
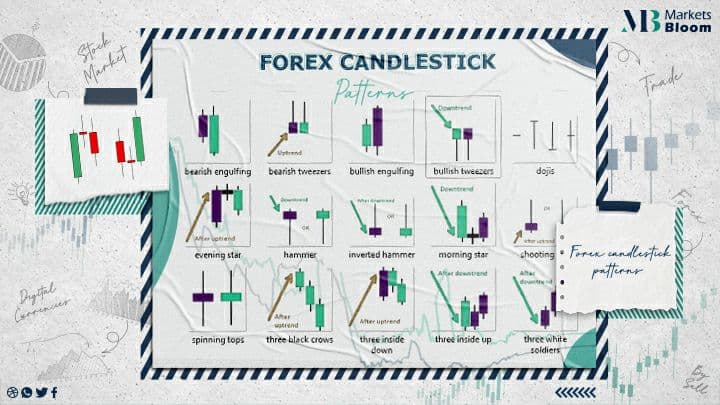
Forex Candlestick Patterns
Japanese candlestick charts give traders a greater depth of information than traditional bar charts. They provide various visual cues that make understanding price action easier and permit traders to spot forex patterns more clearly.
Candlesticks Explained:
If the candle body is black or red the closing price is lower than the opening price – this is referred to as a bear candle. On the other hand, a white or a green body means that the closing price is higher than the opening price – this is referred to as a bull candle.
A price closing where it opened, or close to where it opened, is called a Doji. By looking at candlesticks, traders can see :
“momentum…direction….now-moment buyers or sellers, and common market bias.”
How to measure the length of a candle:
The high of a Forex candlestick works as a resistance, while the low works as a support. The bigger the candle, the greater the levels of support and resistance are.
Three main components of candlestick charts:
Size & length of the whole candle
Relationship between open & close
Shadows and Relationship to the body of the candle
Size & length of the whole candle:
Candles that open at the low, close at the high, or candles that are totally long are a common occurrence. If there is a long downtrend, such a candle refers to a major trend reversal is occurring. On the contrary, after a long uptrend, if an unusually long candle closes, that would display a long wick to the upside, or a strong BEARISH body right from the top.
Relationship between open & close:
In BULLISH market conditions, or during a strong uptrend, buying will usually happen on the open. The price should increase, and a hollow, white candle is formed. The bulls direct the price action in the market, the length, or the distance between the open and the close reflects their dominance.
In BEARISH market conditions, or during a powerful downtrend, a dark body candle should form. This represents sellers entering the market on the open and dominating that particular time. Candlestick charts allow for big analyses from the form and color of the body of the candle, in comparison with bar charts.
Shadows and Relationship to the body of the candle:
The length of the wick shows the price low and/or high when comparing with the open and close prices shown in the real body of the candle, which illustrates the market’s denial of support or a resistance level. If we see long tails, or shadows, formed at the bottom of the body, the main factor to consider is whether they form after a long downtrend. This indicates the potential for the trend to exhaust itself, and that the demand is rising or that the supply is dwindling.
If we have tails, or shadows, shaped at the tops of real bodies, especially after a long price rise, this indicates that the demand is drying up and that the supply is increasing. The greater the shadow, the more important it is to analyze it with the real body, as this may signify the strength of the reversal. The strongest of those are pins.
If the Bullish pin bar’s tail is pinning down, rejecting support, we would see a surge of ‘now-moment buyers’, and, consequently, the price would increase.
On the contrary, when a bearish pin bar’s tail is pinning up, and rejecting resistance, we would see a surge of ‘now-moment sellers’, and the price usually decreases in this instance. The strongest reversal candles have wicks that are longer than the bodies, and a small nose, or no nose at all.
Strong momentum candles:
Strong momentum candles, which open either at support or a resistance level are called Marubozu candles. The Marubozu candle is a momentum candle with a small, or no, tail. This type of candlestick pattern is strong and means a lot regarding price movement. Marubozu defines a powerful selling-off resistance or a strong buying-off support. Marubozu means ‘bald head’ or ‘shaved head’ in Japanese.
This is because such a candle does not have a shadow, or the shadow is very small. In modern market trading, a Marubozu has a very small wick on both sides, and may still be considered valid.
A white Marubozu candle appearing in an uptrend may propose a continuation, while in a downtrend, a white Marubozu can mark a potential BULLISH reversal pattern.
Conversely, the Black Marubozu appearing in a downtrend may propose its continuation, while in an uptrend, a Black Marubozu can mark a potential BEARISH reversal pattern.
Important forex candlestick patterns explained:
Candlestick patterns happen very often in the forex market, here is a list of some of the most popular ones:
Hammer
Shooting star
Hanging man
Piercing line
BULLISH / BEARISH engulfing
Dark cloud
~The Hammer:
The Hammer candle has a long lower shadow, which is twice the length of the real body. It is a BULLISH candlestick pattern that appears at the bottom of downtrends. The body can be either BULLISH or BEARISH but it is considered to be stronger if it’s BULLISH.
~The shooting star:
The shooting star candle appears in uptrends, marking a potential reversal. Also The wick is long and longer than the body. The body can be BULLISH or BEARISH, but it is considered to be stronger if it is BEARISH.
~The hanging man:
It is similar to the Hammer candle, but it happens mainly at the top of uptrends and can work as a warning of a potential downward reversal.
~The piercing line:
It is a BULLISH reversal candlestick pattern. This pattern happens when the 2nd BULLISH candle closes over the middle of the 1st BEARISH candle. The 2nd candle’s open is lower than the 1st candle’s close. In the fx market, the pattern is valid even if the 2nd candle’s open is equal to the first candle’s close.
BULLISH and BEARISH engulfing candle:
BULLISH and BEARISH engulfing candles are reversal patterns. It usually happen at the bottom of a downtrend, while BEARISH candles are spotted at the top of an uptrend. The BULLISH engulfing pattern is characterized by the 2 candles. The 1st one is contained within the real body of the nd candle, which is always BULLISH.
~The BEARISH engulfing pattern is characterized by 2 candles. And The first one is contained within the real body of the second candle, which is always BEARISH.
The dark cloud cover:
The dark cloud cover candle is a BEARISH reversal pattern that shows in uptrends. It consists of two candles. The first one is BULLISH, and the second one is BEARISH. Also The dark cloud cover candle is formed when the 2nd candlestick opens over the close of the 1st candlestick, but then drops and closes over the open price of the 1st candlestick.
The dark cloud cover candlestick is valid even when the 2nd candlestick opens at the close of the 1st candlestick. However, is that the 2nd candle in this pattern should close somewhere lower than the 50% mark of the 1st candle’s body.
Master candle concept:
The master candle is a concept to most price action traders. It is defined by a 30-150 pip candlestick that engulfs the next 4 candlesticks. The breakouts of the master candle can be traded if the (5th-6th-7th) candlestick breaks the range for a breakout trade to become valid.
About Marketsbloom:
Markets Bloom is a trading academy consisting of former trading industry professionals. Our aim is to help all types of traders looking to trade in the financial markets.
By registering with us, you will gain amazing insights into common issues traders face as well as how to instantly improve your trading approach. Our team of experts will be with you every step of the way on your journey to becoming a better trader.
For more information on our services contact us
Our Facebook page: Markets Bloom