RSI Trading Forex Strategy For Day Trading
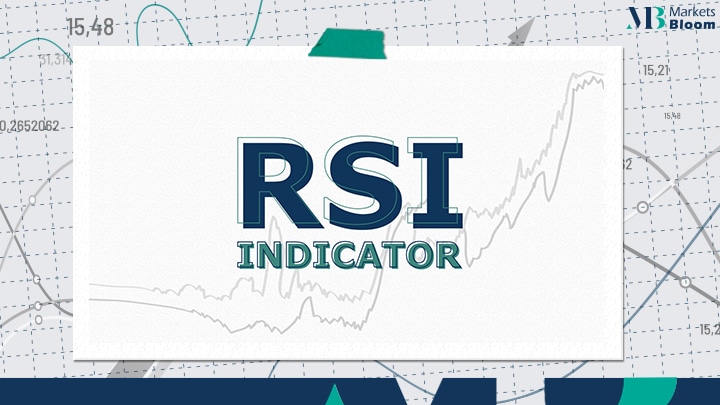
The RSI stands for relative strength index. It is a momentum indicator that shows the price of an asset compared to the recent price action. Also It helps traders in understanding whether the price is overbought or oversold levels. It is an oscillator, so it moves from Zero to 100. When the value of the RSI falls below 30, it’s said to be in an oversold region, so we can expect the price to make an up move. Contrarily, if the RSI goes above 70, it’s said to be in an overbought region. Hence, we can expect the price to make a down move. One thing to note here is that the price will not always respect the oversold and overbought levels.
RSI Explanation
In an uptrend, the price can stay in an overbought region for a long time. Conversely, in a downtrend, the price remains oversold for a long time. So, the trader can’t blindly use the overbought and oversold signals on the RSI for our trading. We can notice that in an uptrend, the price respects the oversold levels. Similarly, in a downtrend, the price tends to regard the overbought levels. This information is very crucial for our strategy. Now we will use a second relative strength index indicator to identify the trend of the market. A popular way of using the relative strength index:
is to use 60 and 40 levels as overbought and oversold levels on a higher time frame. So, in this strategy, our main trading time frame will be the 15 minutes chart. Therefore we can plot the RSI and select the higher time frame for the RSI calculation. For this strategy, we will set the calculation of this RSI to a daily time frame. We can do that by going into indicator settings and selecting the daily time frame. We will change the overbought and oversold levels to 60 and 40. When the daily relative strength index is trading above the 60 levels, we will consider the price to be in an uptrend, and when the daily RSI is trading below the 40 levels, we will consider the price to be in a downtrend.
Buying and selling RSI cases:
Buying cases:
The trader wants the daily RSI to be above 60. When the daily RSI is above 60, the price is in an uptrend.
The current RSI should be below 30. When the current time frame RSI goes below 30, it provides us with an opportunity to enter long on the long term uptrend. So, the trader will look to buy when the RSI is below 30.
Enter long when the relative strength index closes above 30 levels. Traders will enter a buy position when the RSI closes above 30 on the chart.
Selling cases:
The trader wants the daily RSI to be below 40. When the daily RSI is below 40, this shows that the price is in a downtrend.
The current RSI should be above 70. When the current time frame relative strength index goes above 70, it provides us with an opportunity to enter short trade on the long term downtrend. So, The trader will look to buy when the RSI is above 70.
Enter short when the RSI closes below 70 levels. Traders will enter the sell position when the RSI closes below the 70 levels on the chart. Read more
This simple trading strategy uses only two RSIs.With this strategy, we are not saying that the trader will make profits on every trade, but it can give the trader an extra edge over the markets. The main logic behind this strategy is that we will look to enter long term trends. Still, a trader needs strong risk management and discipline to execute any plan.
Test this strategy yourself before investing real money into it. Register now and get a demo account containing $10,000.
For more information don’t hesitate to contact us.