The Oscillator of Moving Average (OsMA Indicator)

The Oscillator of Moving Average Indicator (OsMA), is a tool that tries to point out whether a market is Overbought or Oversold.
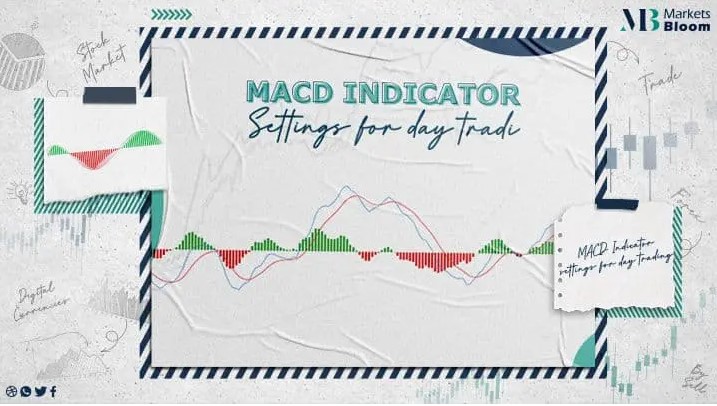
The Oscillator of Moving Average is the contrast between an oscillator and its smoothed version. More specifically, the values displayed by The Oscillator of Moving Average Indicator are commonly derived from the MACD indicator.
It is calculated as the contrast between the MACD and the signal line value:
OsMA = MACD – signal
You don’t always have to apply a MACD — you can use any oscillator, applying a basic principle of calculating the OsMA is the difference between an oscillator and its smoothed average. The common form of OsMA uses a MACD. As this is the method utilized by MT4, this is what we will primarily be focusing on.
Using OsMA Indicator in MT4
The Moving Average Oscillator is of the standard indicators bundled with the MT4. The MT4 OsMA deals exclusively with the MACD values.
Clicking on the OsMA launches a dialogue window that allows you to set 4 basic parameters. Three of these are the times over which the various averages will be calculated. The final choice, ‘Apply to’, defines the kind of price value used for the calculations.
also The MT4 OsMA applies a MACD, with a simple moving average (SMA) used for the signal line. The default values for the slow and fast EMAs are basic and are used in the MACD construction. That is, the fast EMA is set as 12 times, and the slow EMA, like 26 times.
MACD is the difference between these 2 values:
MACD = fast EMA — slow EMA
OsMA then subtracts the signal line (the 9-time SMA of MACD) from this.
Remember, The Oscillator of Moving Average is the difference between a MACD and a 9-time SMA of the MACD. The greatest peaks and troughs of the histogram mark those times when the MACD has diverged most heavily from its moving average. These are the times when you expect a greater reversal probability.
Trading with the Oscillator of Moving Average Indicator
Increasing the OsMA Indicator values proposes buying pressure in the market, regardless of whether those values are over or under zero. Similarly, decreasing OsMA Indicator levels suggest selling pressure. Crossing the zero line is a confirmation of the state of the market. A descending cross is Bearish, whereas an upward cross is Bullish.
Look out for divergence between the movement of the OsMA Indicator, and the movement of price. This is a sign to help you judge how much conviction to have in a market move. For example, if the market is spotting new highs, but the OsMA Indicator is failing to do so, we would suggest weakness in the trend. Finally, a change in the direction of the OsMA Indicator indicates a trend change. If the Osma Indicator stops declining and instead starts to rise in value, it is more favorable to belong rather than short.
Forex OsMA Indicator: Strengths and Weaknesses
One of the defects of the OsMA Indicator comes from its naturally heavy use of moving averages — similar to the MACD. This means that it is a lagging indicator. In volatile markets, this will restrict your ability to productively use the indicator. In such conditions, the indicator tends to give false signals. The indicator can be useful as a way of confirming shifts in trending conditions.
One of the OsMA Indicator’s chief advantages is making it simple to visually identify oversold or overbought levels.
The surest way to discover what works and what doesn’t is to give it a try. You can test your strategies with a demo account. This allows you to trade live market prices without taking on any risk.
About Marketsbloom:
Markets Bloom is a trading academy consisting of former trading industry professionals. Our aim is to help all types of traders looking to trade in the financial markets.
By registering with us, you will gain amazing insights into common issues traders face as well as how to instantly improve your trading approach. Our team of experts will be with you every step of the way on your journey to becoming a better trader.
For more information on our services contact us
our facebook page: Markets Bloom


