Best Technical Indicators
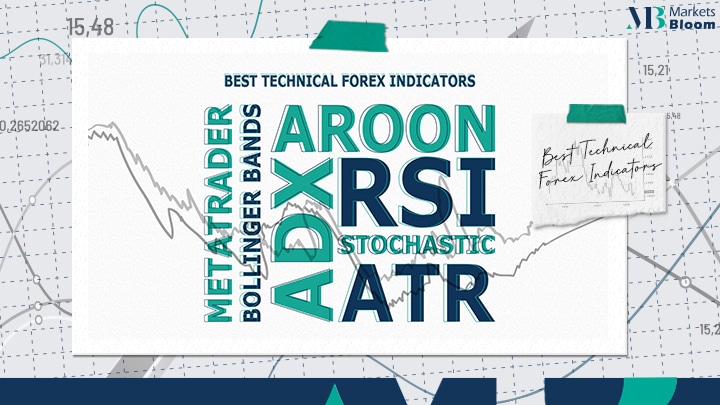
This article will show some of the best fx technical indicators available, involving trend indicators such as :
– Average Directional Movement Index (ADX) indicator.
– Aroon indicator.
– Moving Average Convergence / Divergence (MACD) indicator.
– momentum indicators like the Relative Strength Index (RSI) indicator, the Stochastic Oscillator indicator, and much more!
What are Technical Indicators?
Technical indicators are mathematical instruments that analyze one of the five following figures:
– Open price.
-High.
– Low.
-Closing price and volume.
As a result of the calculation, technical indicators are arranged graphically as chart patterns. Occasionally they overlay the price chart, and sometimes they are drawn in a separate window.
Most technical indicators were developed for the stock market and daily charts because back in the day of their initial creation, 24 hours was about as often as trading charts were updated. This was about 30 years before the internet.
Trend Indicators
Average Directional Movement Index (ADX)
This indicator is a Forex technical analysis indicator of trend strength.. and it is built upon the Exponential Moving Averages of the two other indicators: +DI & -DI. The Directional Movements are a calculation of how a recent day’s highs, lows, and closing are related to the past day’s highs, lows, and closing. and the amount of these figures is then divided by the Average True Range (ATR).
The +DI shows how strong the BULL is today, compared to yesterday.. while the -DI shows how strong the BEAR is today, compared to yesterday. This indicator takes the values of +DI and -DI, and shows us who is stronger today, compared to yesterday – the BULL or the BEAR.
Graphically speaking:
the ADX with the +DI and the -Di looks like 3 lines twisted with each other, moving on the scale of 0 to 100. If the ADX is under 20, the trend (whether BULLISH or BEARISH ) is weak. The threshold of 40 indicates a trend strength, and everything over 50 is a strong trend. If the +DI is over the -DI, the bull is overpowering the bear. The curvature of lines has value, demonstrating how fast the rate of change is. The ADX is a lagging indicator, frequently used to evaluate the strength of a trend.
Aroon
The Aroon is a forex trading technical indicator that gauges if there is a trend, how it’s progressing, and how strong it is. Aroon indicators focus on the idea that the trend can be gauged by evaluating how recent the past highest highs and lowest lows were. The newness of the high-rise high is reflected in the Aroon’s BULLISH line, while the newness of the lower lows is reflected in the Aroon’s BEARISH line.
The lines then oscillate from 0 to 100. For instance, when the BULLISH line is squeezed to the top of the scale around the 100 marks, and the BEARISH line is barely over the bottom at 0, higher highs are often, while lower lows are rarely- and this all means that we have a powerful BULLISH trend. Crossovers mean that the trend direction changes. The Aroon is also a lagging indicator and is used to verify whether a trend has remained intact.
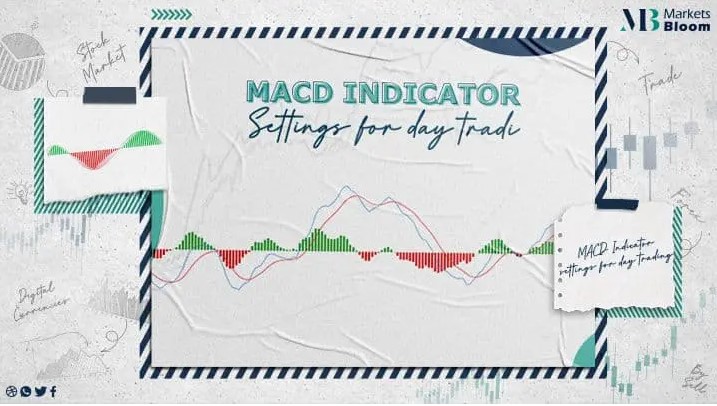
Moving Average Convergence / Divergence (MACD):
The MACD indicator is meant to show changes in the strength, direction, momentum, and duration of a trend. It is built upon moving averages of 12 & 26 times, but with some interesting alterations.
There are 2 things you can conclude from this alone. Applying MA is similar to applying a lagging indicator; 12 & 26 sound a lot like a trading fortnight and a trading month, thus the indicator is meant to be applied on daily charts.
The indicator consists of the MACD line – the difference between the 12 EMA & 26 EMA, the signal line – the same MACD line smoothed by a 9 time SMA, and the histogram, which is the contrast between the MACD and the signal. The bars along the 0 axis – the histogram – are often applied to identify divergences. A divergence happens when the price forms a bigger high or a lower low that is not supported by the histogram, also making a higher high or a lower low, accordingly. A divergence signs the change in the price direction.
Momentum Indicators
Relative Strength Index (RSI)
The Relative strength index (RSI) indicator is the first in the class of momentum indicators alongside the Williams % range and the Stochastic, which serves the same main aim, but in slightly varying ways. Momentum indicators are used to signal if a tool is being overbought or oversold, by gauging the velocity and the magnitude of price movements.
Momentum is the rate of price change. The RSI contrasts the closing prices of the latest and past candles for the up and downtrends, and then turns the result into an EMA (or in some cases into SMA) and then calculates how the uptrend EMA connects to the downtrend EMA when oscillated on a 1 to 100 scale. The bigger the contrast between today and yesterday – the stronger the momentum.
Therefore, if every future close is higher than the past one, the RSI will be oscillating upward, and as soon as it reaches the 80 threshold – the overbought area – it will constitute a sell signal. If the price makes a high-rise high, while the RSI only makes a lower high, a BEARISH signal is generated and vice versa.
Stochastic Oscillator
Every technical indicator that moves up and down in a set scale has oscillated. That’s how the trend indicator may be an oscillator in terms of its features. The Stochastic Oscillator, like other volume indicators, helps to identify overbought and oversold areas through gauging momentum. In the case of Stochastic, it is done by evaluating how near the closing price was in relation to the price range.
In an uptrend, the price should be closing near the highs of the trading range, and through a downtrend, it should be near the lows. The Stochastic is closely plotted in a 0 to 100 corridor, with basically the same 80/20 overbought/oversold thresholds.
Trade With MT4
MT4 is the best trading platform that offers pro traders a range of exclusive benefits such as:
-Multi-language support.
-Advanced charting capabilities.
-Automated trading.
-The ability to customize and change the platform to fit your individual trading preferences.
-Free real-time charting, trading news.
-Technical analysis and so much more!
Volatility
Average True Range (ATR):
Volatility-based indicators monitor changes in the market price and contrast them to historical values. The range is today’s high, minus today’s low. The true range enlarges it to yesterday’s closing price, if it was outside of today’s range.
ATR is the greater of the following:
Latest high minus the latest low
The absolute value of the latest high less than the past close
and The absolute value of the latest low less than the past close
The bigger the price contrast between one of the above, the higher the ATR goes, and the higher the volatility on the market. This can be useful to know when adjusting your trading stops for instance.
Bollinger Bands:
Bollinger Bands are another volatility indicator that uses an SMA or an EMA, and then envelopes it by 2 basic deviation lines. This builds a dynamic passage for the price to bounce in. Following Mr. Bollinger’s idea, prices are high when close to the upper deviation line, and low when at the lower deviation line, which signifies a turnaround.
Volume Indicators
Gauging the entire market volume of the FX spot market is impossible at the rate and depth required by traders, unlike, say in stocks, commodities, or even Forex futures. The problem is that FX spot is traded over-the-counter (OTC), which means that there is no single clearing location to recalculate volumes.
The volume that is available at your platform came from your broker’s own data stream. Those numbers don’t even remotely start to report the entire worldwide volume.
On-Balance-Volume (OBV)
The OBV indicator is used to gauge increases or decreases in the volume of a traded tool, relative to its price. This follows the idea that volume precedes price, and that it can be used to verify price moves. Mechanically speaking, the entire daily volume is allocated a positive number if it increases, in
comparison to the past day. Similarly, a negative value is assigned if the entire volume has decreased since the last day. When prices go greatly in one direction, so should OBV. A divergence between the price and the OBV would sign weakness in the market move.
About Marketsbloom:
Markets Bloom is a trading academy consisting of former trading industry professionals. Our aim is to help all types of traders looking to trade in the financial markets.
By registering with us, you will gain amazing insights into common issues traders face as well as how to instantly improve your trading approach. Our team of experts will be with you every step of the way on your journey to becoming a better trader.
For more information on our services contact us or visit facebook page by clicking here.