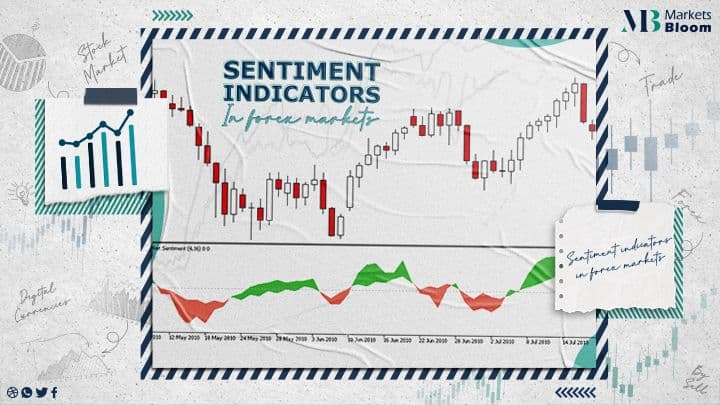
Sentiment Indicators in Forex market
The Forex Market has millions of traders, they all have personal strategies and thought processes. Market Sentiment is the controlling emotional situation of market participants towards market directions. Forex Market Sentiment is frequently used as a method of measuring mass behavior.
Forex Market Sentiment Indicators:
The Forex Sentiment Indicators help to decide whether traders are BULLISH or BEARISH to the latest conditions of the Forex Market.
The Main Sentiment Indicators:
Each price movement of every security has reference to Market Sentiment. Forex Market Sentiment may be the greatest and crucial short-term factor in all price movements. Even when we notice the publication of important news about security or a company.. the eventual price movements are frequently amplified or reduced. This is all down to the question of whether the FOREX market is BEARISH or BULLISH at that time.
There are a lot of efforts to measure market sentiment with great accuracy.. so there are a lot of different types of Sentiment Indicators. Some Sentiment Indicators, like Volume ones, can be used for personal securities. The majority of Sentiment Forex indicators are based on using broad market data.
There are specific Market Indicators that are based on the principle.. whether right or not.. that uninformed Forex traders sometimes make the wrong decision, purchasing at market tops, and accordingly selling at market bottoms.
For example
one of the old Forex Market Sentiment Indicators is formed on odd-lot trading statistics that measure a number of stock shares being purchased or sold in odd lots.. which are less than the 100 shares constituting a round lot.
Being based on the odd-lot theory, those buyers are assumed to have a small amount of money to trade with and thus are expected to be the least advanced players on the FX market. For this reason, it’s expected that they purchase through the time of an optimism peak, and sell during the pessimism period, and when the market bottoms out.
what if we take a look at informed traders ?
If we take a look at informed traders, they show odd-lot purchasing as a sell signal, and conversely odd-lot selling as a purchase sign. They do the opposite of the uninformed FX traders’ actions. Most of these Forex Sentiment Indicators are known as contrarian indicators. The odd-lot isn’t the powerful indicator, due to the fact that the huge majority of odd-lot buyers aren’t traders.
They are purchasing for the long term and when they own
a specific amount of money, which suggests that they are not good Sentiment FOREX Indicators. If we consider that short sellers are FX traders, is the odd-lot short sale ratio. The number of odd-lot short sales divided by the number of odd-lot sales. It works on the premise that a higher odd-lot short sale ratio identifies a forex market bottom
Volume Indicators:
We can outline the rational method of tracking sentiment, and that is by observing the volume on downtrends or uptrends.
High volume works as a confirmation of the trend. Price movements based on low volume have much less importance. It is suggested by pro traders to focus on volume spikes, where volume suddenly expands by 2 or more times than the past average. Those spikes may identify important news about security or a company, so it would be sensible to scan the news.
The time price movements are based on important news, and a new trend may start to form, or the latest trend may be enlarged and prolonged. Another important factor of Forex Market Sentiment Indicators to discuss is the on-balance volume (OBV). It is the cumulative total of where volume is added on the days that the price closes higher, and deducting volume on the specific days when the price closed lower.
Frequently…
the on-balance volume reaches a maximum a few days prior to the price peak and acquires a minimum of a few days just before the price bottoms out. also The OBV indicators point out cumulation by buyers or distribution by sellers. The ACCUMULATION = BUY sign, whilst DISTRIBUTION = SELL sign.
Several traders clarify the VOLUME data by working out what percentage the HIGH close or LOW close is away from the midpoint. It is calculated by supplementing the high price and low price suitably for
the day, and then dividing it by two. As a result, the volume added is adjusted by how much the day’s close diverges from the midpoint.
About Marketsbloom:
Markets Bloom is a trading academy consisting of former trading industry professionals. Our aim is to help all types of traders looking to trade in the financial markets.
By registering with us, you will gain amazing insights into common issues traders face as well as how to instantly improve your trading approach. Our team of experts will be with you every step of the way on your journey to becoming a better trader.
For more information on our services contact us
our facebook page: Markets Bloom