Heiken Ashi Indicator
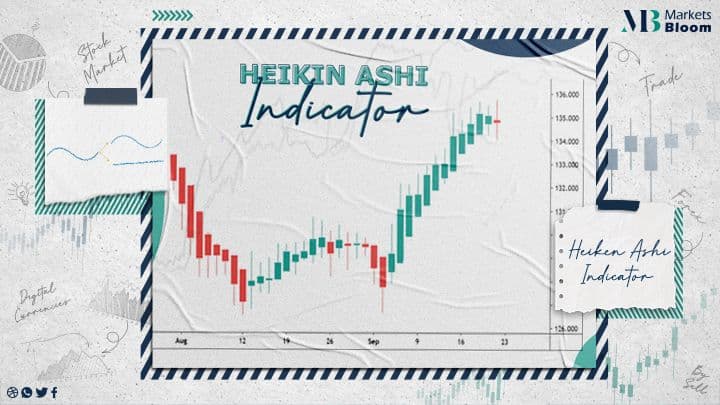
Discover how the Heiken Ashi Indicator could be helpful in trading. Find out what the Heiken Ashi Indicator is, learn about the HeikenAshi trading strategy, and more.
Heiken-Ashi – Should I use it?
One of the techniques that tech traders need to master is spotting Market Trends. Spotting a trend can be hard because of market volatility. Traders have evolved a number of techniques to help see previous short-term price fluctuations. For example, they can apply a smoothing technique. There are a number of indicators created to do this, counting the Heiken Ashi. The advantage of Heiken Ashi is that it permits you to spot trends easily.
What is the Heiken Ashi trading strategy?
Heiken Ashi derived from the Japanese term “HeikinAshi”, which means average bar. The Heiken Ashi indicator modifies how price values are shown on a chart. A Japanese Candlestick offers four pieces of price data in visual form, including:
Open
Close
High
Low
The High refers to the Candlestick’s Upper Wick or Shadow. And The Low refers to the Candlestick’s Lower Wick or Shadow. The Body of a Candlestick refers to the Open & Close.
Basically, if the close is:
Below the open, it shows a red candle or if it is over the open, it shows a blue candle.
Each Candle gives information about the connection between the Open and Close. It displays whether the price ends the period lower or higher than when it started. A fundamental line of thinking is that a filled Candlestick is Bearish.
If the Close is lower than the opening, it means downward pressure on the price. The same rule of thinking suggests that a hollow Candlestick is Bullish. If the Close is higher than the opening it means upward pressure on the price.
Want to know the catch?
In periods of volatility, there are alternating Bullish and Bearish Candles as the price oscillates. The movement makes it hard to see the trend. This is where HeikenAshi comes in. It applies modified candlesticks to fix this problem. Heiken Ashi Candlesticks are similar to conventional ones, but rather than applying Opens, Closes, Highs, and lows, they apply Average Values for these four price metrics.
The HeikenAshi formula :
OPEN = ( Open of past bar + Close of past bar) /2/
CLOSE = ( Open + High + Low + Close ) /4/
HIGH = the Maximum Value from the High , Open , or Close of the latest period
LOW = the Minimum Value from the Low , Open , or Close of the latest period
About Marketsbloom:
Markets Bloom is a trading academy consisting of former trading industry professionals. Our aim is to help all types of traders looking to trade in the financial markets.
By registering with us, you will gain amazing insights into common issues traders face as well as how to instantly improve your trading approach. Our team of experts will be with you every step of the way on your journey to becoming a better trader.
For more information on our services contact us
our facebook page: Markets Bloom