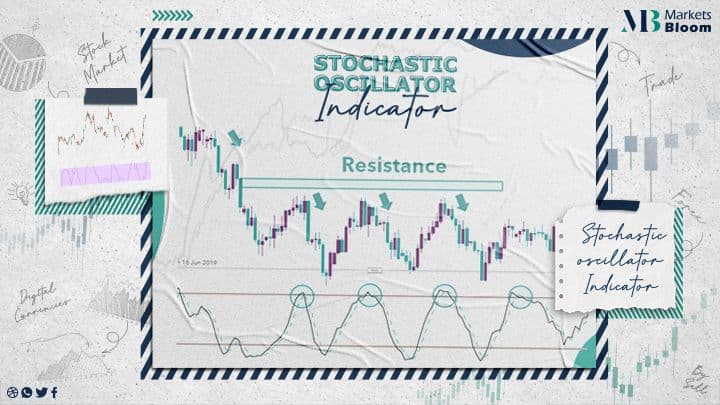
The Stochastic Oscillator Indicator
The Stochastic Oscillator is an indicator that allows for great versatility in trading. It was developed in 1950
by George C. Lane, it is one of the most common indicators used in Forex, indices, and stock trading.
Stochastic Oscillator Indicator:
We can use The Stochastic Oscillator Indicator for the following activities and aims :
Divergence
Day trading
Scalping
Buy / Sell confirmation
Confirmation of Overbought / Oversold
What is the Stochastic Indicator?
The Stochastic Oscillator is a momentum indicator, which contrasts a specific closing price of an asset to its HIGH-LOW range over a set number of times. It is a range oscillator, operating between 100 & 0 by default. There are 2 lines displayed on the Stochastic Oscillator Indicator itself –the SLOW oscillating %K line and a moving average of the same % K that we refer to as %D. Slowing is applied to the indicator’s default setting as a time of 3.
The Stochastic Oscillator Formula:
The Stochastic Oscillator is measured using the %K & %D lines
% K = 100 [ ( C – L14 ) \\ ( H14 – L14 ) ]
C: is the latest closing price
L14: is the lowest price when looking back at the 14 past trading sessions
H14: is the highest price when looking back at the 14 past trading sessions
%K tracks the recent market rate for the currency pair
%D = 3-period simple moving average (SMA) of %K. It is called the ‘STOCHASTIC SLOW’ due its slower reactions to market price changes, as compared to %K.
The periods referred to are the basic periods used, this can be changed for different needs in the settings of the indicator.
Stochastic Divergence:
When the price is making a lower LOW, but the STOCHASTIC is making a highrise LOW– we call it a BULLISH divergence. If the price is making a highrise HIGH, but the STOCHASTIC is making a lower HIGH– we call it a BEARISH divergence.
Divergence occurs after a sharp price movement higher or lower. Divergence is a cue that the price might reverse, and it’s confirmed by a trend line breakout.
About Marketsbloom:
Markets Bloom is a trading academy consisting of former trading industry professionals. Our aim is to help all types of traders looking to trade in the financial markets.
By registering with us, you will gain amazing insights into common issues traders face as well as how to instantly improve your trading approach. Our team of experts will be with you every step of the way on your journey to becoming a better trader.
For more information on our services contact us
our facebook page: Markets Bloom